

A new year with some old challenges – Roger Campbell
Happy New Year.
Welcome to 2016 and let’s hope it is as successful for you all as 2015.
Margins in 2015 were good to excellent, depending on where your business is situated and due largely to high prices offered for Australian pork.
Based on the average cost of production from Pork CRC’s benchmarking project and the average of the sellers and buyers prices reported by APL for the eastern seaboard, the average margin was around $30-$40/pig or $600-$800/sow. Of course some did better than this and others worse. Based on COP and reproduction, the better producers, exceeded the average margin per pig and sow by 180 to 200 percent.
Higher prices are likely to continue through 2016 and will generally be enjoyed by most producers. Aside from renegotiating supply contracts, prices will largely be beyond the control of producers and will generally reflect factors such as beef and lamb prices and the inherent demand for and supply of high integrity Australian pork.
On the other hand, as our benchmarking results reveal, there is plenty of money left on the table associated with improving production efficiency.
There are many aspects of production which affect COP (the ultimate KPI), but for Australia there are a couple of obvious opportunities. The first is feed cost. We have some of the highest feed costs in the world and while some producers have reduced this by using alternative feed and food ingredients, the other strategies are to use less feed or to improve herd feed efficiency.
The average HFC for the Pork CRC benchmarking participants in 2014 was 3.77, which was well above my long term target of 3.6, but almost 50 percent of the herds were under 3.65 and the best came in at 3.4. These are good values, especially as average carcass weight for participants was 79 kg, which in itself increases HFC (see table).
So what affects HFC and what is a realistic target? It starts with your genetics and we know that under ideal conditions (minimal wastage and zero mortality) we have genetics capable of achieving feed: gain values between 75 and 115 kg of 2.55 on a diet with 13.6 MJ DE/kg. These values we see all the time from research projects and they were reported again at the recent APSA meetings for immunocastrates housed in individual pens.
If we assume a generous (high) feed: gain for such pigs from weaning to 100 kg (say 2.2:1) and selling 22 pigs per sow/year at 75 kg carcass weight, your HFC would be 3.29. This reflects the pig’s potential and can be achieved and even exceeded under ideal situations.
Real world
If we assume five percent mortality between weaning and sale, the wean-finish feed: gain would increase from 2.2 to 2.35 and HFC from 3.29 to 3.43. The impact of lower and higher levels of mortality on feed efficiency is pretty much linear.
If we assume five percent feed wastage between wean to sale (100 kg) HFC would increase to 3.56.
At 10 percent wastage, HFC would increase to 3.70.
Pork CRC benchmarking HFC values cover the range 3.4 to 4.0 and so are probably realistic, reflecting differences in genetic potential, post weaning mortality and feed wastage, but it is obvious that while we have good and even great genetics under ideal conditions, feed: gain can only get worse under commercial situations and minimising the extent of the loss is the secret to helping reduce feed use and cost.
Apart from mortality (disease) and feed wastage, the feed efficiency of weaner and grower-finisher pigs is also affected by their thermal environment and how often and by how much they spend below their thermo neutral zone and the unseen consequences of immune system activation. By unseen I mean the pigs might look healthy, but factors such as dust and bacteria in the environment activate the immune system which affects nutrient partitioning and can lead to reduced growth and poorer feed efficiency. Dr Jae Kim of DAFWA is developing an on-farm test kit (strip) for estimating the immune status of growing pigs. Hopefully, this will enable this source of energetic loss to be quantified and reduced.
Feed wastage
Feed wastage is an old issue. We know it occurs but really haven’t been able to quantify it or come up with reliable means of reducing it. It was previously often associated with poor feeder design and repair (lack thereof), but I’m not sure the latter is now the case and I certainly can’t recommend a feeder that has near zero wastage, but they might exist.
Feed wastage in the US has been related to the availability of feed from the pan (pan coverage) and recommendations (photos showing excessive and ideal pan coverage) exist for the ideal pan coverage to minimise feed wastage. I think suppliers of feeders are responsible for their effectiveness and ease of management and hopefully should have information of their wastage potential or lack of it. It is a real issue, but probably outside of the research arena.
In a recent Pork CRC report by Steve Wiedemann (FSA Consulting) on greenhouse gas emissions across 14 production units, feed wastage was estimated using BIGBAL. Estimated feed wastage ranged from 5.5 percent to 7.7 percent and interestingly represented between 33 percent and 43 percent of the volatile solids in the waste stream.
For the same herds, HFC on a live weight basis (assessed over 12 months) ranged from 2.4 to 3.2 and was a major factor contributing to GHG emissions. Indeed, GHG emissions (C02 equivalents) increased from 3.5 to 6.0 kg/kg live weight produced with increasing HFC from 2.4 to 3.2 – another good reason to improve HFC.
Target a HFC of 3.6 but on the understanding that it can be realistically reduced to 3.4 and below.
Volume value
The second opportunity for reducing costs and increasing revenue is by increasing volume – that is the carcass weight sold/sow per year. The latter can be achieved by selling more pigs per sow/year and/or by increasing carcass weight.
Carcass weight is constrained largely by the market and Australia probably has the lightest average carcass weight in the world, which adversely affects the efficiency and cost of pork production throughout the supply chain. At the moment pig price tends to match or override the impact to the farm gate, but there is clearly plenty of inefficiency and cost built into our system because of our light carcass weight.
Reproduction rises
Although reproduction is not set by the market, s we all know it is very hard to improve. Over some 10 years, born alive in Australia has increased by less than 0.8 piglets per litter and the number weaned (annually) by about 2.2 pigs per sow. The latter reflects the gradual increase in born alive and good farrowing house management and the management of sows and empty days in general.
More recently, we’ve seen a number of Pork CRC benchmarking participants achieve more marked improvements in litter size and number weaned, with the best Australian herd reporting 12.9 born alive and 26.6 piglets weaned per sow for 2014-2015. The top three Australian herds averaged 12.3 born alive and 25.3 weaned per sow for the year. The top herd was in NZ and weaned almost 30 pigs per sow in 2014-2015. The born alive was 13.3 and the high number weaned per sow per year was due to a relatively low pre weaning mortality (11 percent) and weaning at 20 days.
These are all good results and I think in the short term we will learn more by listening to how these producers have achieved what they have and ensuring attention to detail, rather than by investing in research that is likely to deliver only small or incremental improvements in reproduction. Having said that, I have seen a couple of very exciting proposals from University of Adelaide researchers which question some of the current concepts of nutrition in lactation and have the potential to address some major constraints on the efficiency of production in Australia.
Born alive
For now the target for born alive should be set at 12.5 and piglets weaned per sow per year at 25.5. We have the genetics and knowhow to achieve these figures, but some producers may need to go back to basics. As I said, it’s best in the short term to learn from those achieving the good results.
Given where prices are at, anything you can do to increase carcass weight to the upper limit of those you are supplying should be done.
Price points
After reviewing APL’s prices publication in December 2015, I thought it worthwhile to look at the effects of price and carcass weight on both COP and revenue and predicted margins. I wanted to see if the higher price paid for pigs in the 40-60 kg range was adequate to overcome the effect of the lighter carcass weight on overhead costs. This was not the case.
The table below shows the effects of average carcass weights of 60, 75 and 85 kg on COP and predicted margins, assuming 22 pigs sold/sow/year. The carcass weights chosen are at the top of the three major categories reported by APL.
The average prices for pigs between 40 and 60, 60 and 75 and 75 and 85 kg carcass weight were $4.18, $3.82 and $3.80/kg carcass weight, respectively. In the table these have been adjusted for the contribution of sow meat to the carcass weight produced and as a component of HFC.
Increasing carcass weight increases HFC at a higher rate than it reduces feed cost, such that feed cost ($/kg carcass weight) increases but is offset by a reduction in overhead costs. The latter has a small effect on margin per kg of carcass weight but markedly increases the margin per pig and on a per sow basis. The latter can be worked out from the table.
Based on the APL prices at the time, the price needed for carcasses at 60 and 75 kg to achieve the same margin per pig and per sow as the 85 kg carcass were $4.65 and $4.04/kg respectively. The breakeven for each carcass category, independent of pig price, is shown under COP and clearly will vary with feed costs.
Effects of carcass weight at average Eastern Seaboard Prices (APL) for December 11 on the estimated cost of production (COP) and margin per kg carcass weight
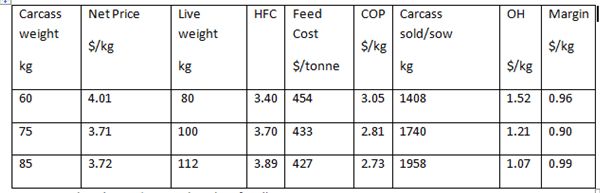
OH – overhead costs (costs other than feed)
In next month’s APN column, I intend outlining what is happening in Australia in a global context, but we need to set some realistic targets for 2016 and there’s no better time to do this than in January.
1st Published APN January 2016